Who is getting money, who is losing money, and why — 2026-10-30
Getting money
Energy +1.52%
Energy +1.52%
Losing money
Technology -4.40%
Technology -4.40%
Why
Top accumulation name INTC (Technology) -28.58% on 4.6x volume — $29.7B traded. Heavy single-name flow.
Top accumulation name INTC (Technology) -28.58% on 4.6x volume — $29.7B traded. Heavy single-name flow.
Volume was thin across sectors, so today's moves are not volume-confirmed. 88% of watchlist cap ($115.86T of $131.07T), 1841 names excluded
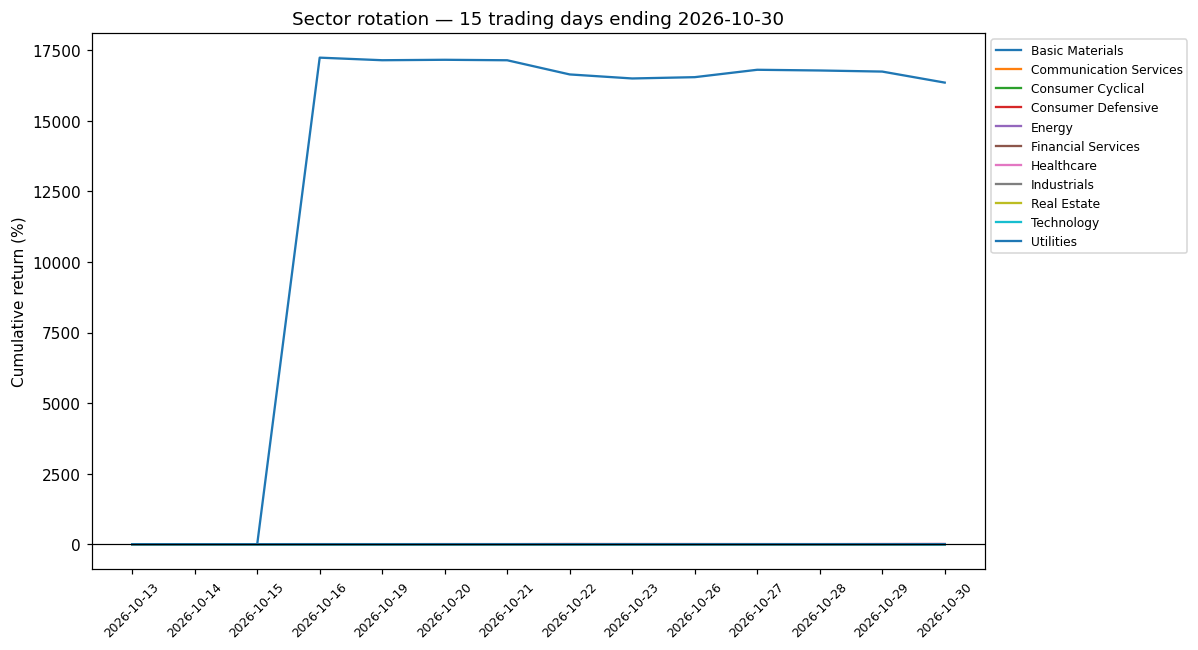
Top / bottom sectors
Top gaining
- Energy +1.52%
- Consumer Defensive +1.33%
- Healthcare +0.71%
- Real Estate +0.10%
- Utilities +0.01%
Top losing
- Financial Services -0.77%
- Communication Services -0.85%
- Basic Materials -2.32%
- Industrials -2.59%
- Technology -4.40%
Accumulation signals (15 — 1 buying, 14 distribution)
| Symbol | Sector | Return | Vol | $ volume |
|---|---|---|---|---|
| INTC | Technology | -28.58% | 4.6x | $29.7B |
| AMD | Technology | -10.88% | 2.0x | $19.9B |
| SNDK | Technology | -13.47% | 2.1x | $19.8B |
| QCOM | Technology | -11.12% | 2.4x | $4.0B |
| KLAC | Technology | -5.69% | 2.1x | $3.5B |
| RDDT | Communication Services | -29.22% | 6.8x | $3.1B |
| COIN | Financial Services | -10.62% | 2.7x | $3.0B |
| REGN | Healthcare | +13.33% | 4.4x | $2.6B |
| TER | Technology | -7.38% | 2.7x | $2.4B |
| ARM | Technology | -9.97% | 2.3x | $2.1B |
Breadth flips: see full report · New opposed sector pairs: 11 · New capitulations: none
Daily archive
- 2026-10-30 — getting: Energy +1.52% · losing: Technology -4.40%
- 2026-10-29 — getting: Healthcare +2.03% · losing: Communication Services -4.41%
- 2026-10-28 — getting: Technology +0.96% · losing: Real Estate -0.65%
- 2026-10-27 — getting: Basic Materials +1.93% · losing: Energy -1.68%
- 2026-10-26 — getting: Technology +1.43% · losing: Communication Services -1.02%
- 2026-10-23 — getting: Energy +2.32% · losing: Consumer Defensive -1.43%
- 2026-10-22 — getting: Consumer Defensive +2.81% · losing: Technology -3.08%
- 2026-10-21 — getting: Industrials +1.82% · losing: Communication Services -1.29%
- 2026-10-20 — getting: Healthcare +2.65% · losing: Communication Services -0.36%
- 2026-10-19 — getting: Technology +1.22% · losing: Utilities -1.59%
- 2026-10-16 — getting: Energy +2.52% · losing: Technology -2.63%
- 2026-10-15 — getting: Healthcare +1.82% · losing: Basic Materials -3.40%
- 2026-10-14 — getting: Healthcare +2.24% · losing: Technology -2.79%
Weekly accumulation scans
Market-structure reporting only: flows, breadth and signals. Not personalized investment advice, and not buy or sell recommendations.