Weekly accumulation — ending 2026-10-30
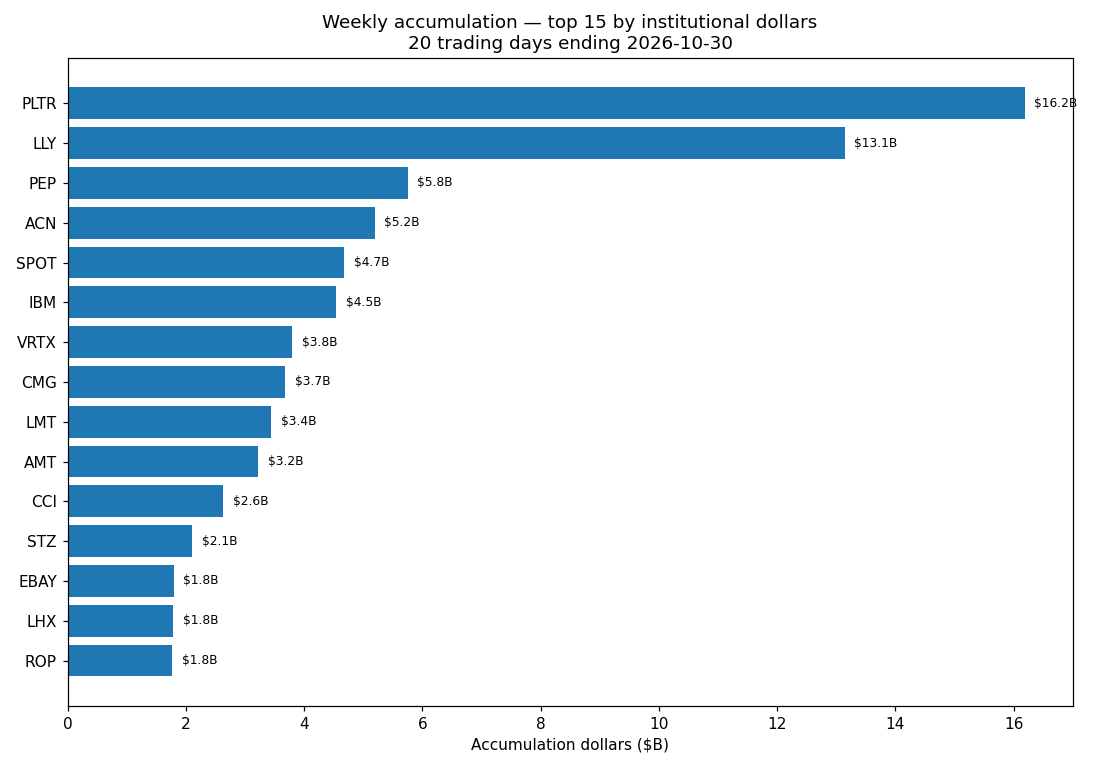
Weekly accumulation — 20 trading days ending 2026-10-30
129 tickers with net accumulation ≥ 2 days (accumulation day = +2% on >1.5x 20-day avg volume; market cap ≥ $1B). Ranked by institutional dollars.
| # | Symbol | Sector | MC | Acc d | Dist d | Acc $ | 20d ret |
|---|---|---|---|---|---|---|---|
| 1 | PLTR | Technology | $446.9B | 2 | 0 | $16.2B | -2.8% |
| 2 | LLY | Healthcare | $1.18T | 2 | 0 | $13.1B | +24.0% |
| 3 | PEP | Consumer Defensive | $179.2B | 2 | 0 | $5.8B | +9.3% |
| 4 | ACN | Technology | $153.3B | 2 | 0 | $5.2B | +32.4% |
| 5 | SPOT | Communication Services | $109.2B | 2 | 0 | $4.7B | +22.9% |
| 6 | IBM | Technology | $218.7B | 2 | 0 | $4.5B | +16.4% |
| 7 | VRTX | Healthcare | $126.7B | 3 | 0 | $3.8B | +11.0% |
| 8 | CMG | Consumer Cyclical | $37.8B | 2 | 0 | $3.7B | +3.4% |
| 9 | LMT | Industrials | $127.3B | 2 | 0 | $3.4B | +25.7% |
| 10 | AMT | Real Estate | $86.3B | 2 | 0 | $3.2B | +15.7% |
| 11 | CCI | Real Estate | $35.0B | 2 | 0 | $2.6B | +31.2% |
| 12 | STZ | Consumer Defensive | $22.2B | 3 | 0 | $2.1B | +19.4% |
| 13 | EBAY | Consumer Cyclical | $53.5B | 2 | 0 | $1.8B | +13.5% |
| 14 | LHX | Industrials | $46.3B | 2 | 0 | $1.8B | +17.2% |
| 15 | ROP | Technology | $37.9B | 2 | 0 | $1.8B | +28.4% |
| 16 | USB | Financial Services | $91.5B | 2 | 0 | $1.7B | +3.8% |
| 17 | WCN | Industrials | $42.8B | 2 | 0 | $1.7B | +19.3% |
| 18 | CRH | Basic Materials | $56.0B | 2 | 0 | $1.6B | +9.9% |
| 19 | AJG | Financial Services | $65.3B | 2 | 0 | $1.5B | +21.5% |
| 20 | PNR | Industrials | $8.5B | 3 | 0 | $1.3B | +25.5% |
| 21 | BTI | Consumer Defensive | $129.6B | 2 | 0 | $1.3B | +16.3% |
| 22 | LH | Healthcare | $25.8B | 2 | 0 | $1.1B | +17.1% |
| 23 | SBAC | Real Estate | $19.8B | 2 | 0 | $1.0B | +15.7% |
| 24 | EG | Financial Services | $14.9B | 2 | 0 | $1.0B | +12.0% |
| 25 | ROL | Consumer Cyclical | $16.1B | 2 | 0 | $0.9B | +16.7% |
_Footprints, not proof: high-volume up-days show institutional-size buying but not who is buying._
Market-structure reporting: capital flows, breadth and volume signals across Fam's watchlist. Not personalized investment advice, and not buy or sell recommendations.