Daily Money Tracker — 2026-10-19
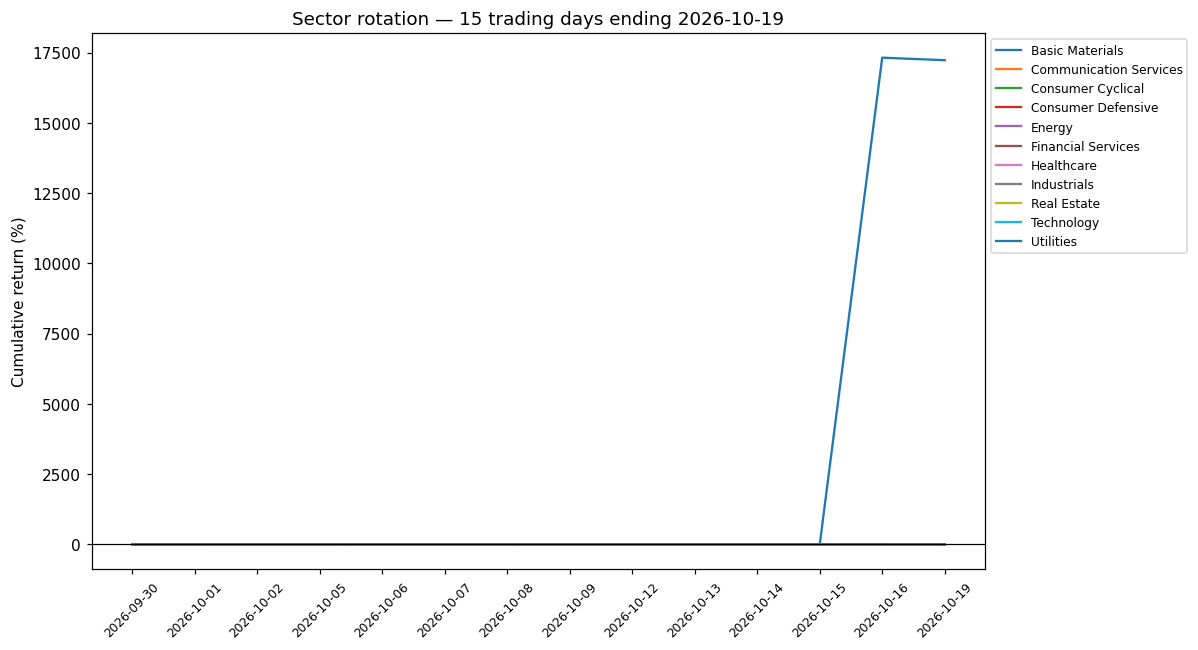
Daily Money Tracker — 2026-10-19
(1) WHO IS GETTING MONEY
Technology +1.22% (thin volume — not confirmed) is pulling the money today.
(2) WHO IS LOSING MONEY
Utilities -1.59% (REAL MOVE) is where money is leaving.
(3) WHY
Top accumulation name IRON (Healthcare) +38.86% on 13.0x volume — $670.4M traded. Heavy single-name flow.
Top / bottom sectors
Top 5 gaining
- Technology +1.22% (vol 1.12x, thin)
- NVDA: +1.38% (contrib +0.21%)
- SKHY: +4.67% (contrib +0.14%)
- TSM: +1.84% (contrib +0.12%)
- Driver hint: NVDA, SKHY, TSM leading the gains.
- Consumer Cyclical +1.21% (vol 1.04x, thin)
- AMZN: +4.98% (contrib +1.11%)
- TSLA: +3.76% (contrib +0.44%)
- VLKPF: +9.33% (contrib +0.03%)
- Driver hint: AMZN, TSLA, VLKPF leading the gains.
- Communication Services +0.02% (vol 0.96x, thin)
- GOOG: +0.96% (contrib +0.33%)
- RCRUY: +3.53% (contrib +0.05%)
- NTDOF: +5.50% (contrib +0.03%)
- Driver hint: GOOG, RCRUY, NTDOF leading the gains.
- Healthcare -0.38% (vol 0.84x, thin)
- UNH: +1.36% (contrib +0.04%)
- MRNA: +4.07% (contrib +0.03%)
- ISRG: +1.52% (contrib +0.02%)
- Driver hint: UNH, MRNA, ISRG leading the gains.
- Consumer Defensive -0.51% (vol 0.81x, thin)
- COST: +0.65% (contrib +0.04%)
- PEP: +1.58% (contrib +0.04%)
- MNST: +2.34% (contrib +0.03%)
- Driver hint: COST, PEP, MNST leading the gains.
Top 5 losing
- Energy -0.59% (vol 0.83x, thin)
- SHEL: -1.73% (contrib -0.09%)
- VLO: -2.56% (contrib -0.06%)
- TTE: -1.52% (contrib -0.05%)
- Driver hint: SHEL, VLO, TTE dragging it down.
- Industrials -0.63% (vol 1.28x, thin)
- SMAWF: -2.56% (contrib -0.04%)
- SBGSY: -3.60% (contrib -0.04%)
- CYATY: -2.14% (contrib -0.04%)
- Driver hint: SMAWF, SBGSY, CYATY dragging it down.
- Real Estate -0.86% (vol 0.87x, thin)
- PLD: -1.32% (contrib -0.09%)
- DLR: -1.69% (contrib -0.06%)
- AMT: -1.21% (contrib -0.06%)
- Driver hint: PLD, DLR, AMT dragging it down.
- Financial Services -0.91% (vol 91.53x, REAL)
- CICHF: -9.45% (contrib -0.12%)
- JPM: -1.82% (contrib -0.07%)
- DBSDF: -3.87% (contrib -0.03%)
- Driver hint: CICHF, JPM, DBSDF dragging it down.
- Utilities -1.59% (vol 5.98x, REAL)
- IBDRY: -2.81% (contrib -0.14%)
- NEE: -2.04% (contrib -0.10%)
- NGGTF: -4.08% (contrib -0.10%)
- Driver hint: IBDRY, NEE, NGGTF dragging it down.
Breadth by market-cap tier
| Sector | Tier | % Up | % Down | % Flat | n |
|---|---|---|---|---|---|
| Basic Materials | $1T+ | n/a | n/a | n/a | 0 |
| Basic Materials | $100B-$1T | 15% | 62% | 23% | 13 |
| Basic Materials | $10B-$100B | 32% | 54% | 14% | 69 |
| Basic Materials | <$10B | 30% | 32% | 38% | 364 |
| Communication Services | $1T+ | 50% | 50% | 0% | 2 |
| Communication Services | $100B-$1T | 21% | 79% | 0% | 14 |
| Communication Services | $10B-$100B | 30% | 41% | 29% | 93 |
| Communication Services | <$10B | 33% | 28% | 39% | 145 |
| Consumer Cyclical | $1T+ | 100% | 0% | 0% | 2 |
| Consumer Cyclical | $100B-$1T | 30% | 70% | 0% | 23 |
| Consumer Cyclical | $10B-$100B | 37% | 51% | 12% | 98 |
| Consumer Cyclical | <$10B | 17% | 30% | 53% | 366 |
| Consumer Defensive | $1T+ | n/a | n/a | n/a | 0 |
| Consumer Defensive | $100B-$1T | 29% | 71% | 0% | 17 |
| Consumer Defensive | $10B-$100B | 19% | 65% | 15% | 52 |
| Consumer Defensive | <$10B | 20% | 26% | 54% | 167 |
| Energy | $1T+ | n/a | n/a | n/a | 0 |
| Energy | $100B-$1T | 7% | 80% | 13% | 15 |
| Energy | $10B-$100B | 34% | 39% | 27% | 71 |
| Energy | <$10B | 32% | 29% | 39% | 177 |
| Financial Services | $1T+ | 100% | 0% | 0% | 1 |
| Financial Services | $100B-$1T | 12% | 74% | 14% | 66 |
| Financial Services | $10B-$100B | 17% | 63% | 20% | 188 |
| Financial Services | <$10B | 24% | 50% | 26% | 867 |
| Healthcare | $1T+ | 0% | 100% | 0% | 1 |
| Healthcare | $100B-$1T | 30% | 61% | 9% | 23 |
| Healthcare | $10B-$100B | 42% | 51% | 7% | 92 |
| Healthcare | <$10B | 52% | 20% | 28% | 493 |
| Industrials | $1T+ | 100% | 0% | 0% | 1 |
| Industrials | $100B-$1T | 17% | 83% | 0% | 29 |
| Industrials | $10B-$100B | 25% | 63% | 12% | 172 |
| Industrials | <$10B | 23% | 25% | 52% | 476 |
| Real Estate | $1T+ | n/a | n/a | n/a | 0 |
| Real Estate | $100B-$1T | 0% | 100% | 0% | 2 |
| Real Estate | $10B-$100B | 14% | 77% | 9% | 43 |
| Real Estate | <$10B | 8% | 40% | 52% | 210 |
| Technology | $1T+ | 80% | 20% | 0% | 5 |
| Technology | $100B-$1T | 84% | 16% | 0% | 38 |
| Technology | $10B-$100B | 63% | 32% | 5% | 114 |
| Technology | <$10B | 44% | 21% | 36% | 598 |
| Utilities | $1T+ | n/a | n/a | n/a | 0 |
| Utilities | $100B-$1T | 0% | 100% | 0% | 5 |
| Utilities | $10B-$100B | 14% | 67% | 19% | 85 |
| Utilities | <$10B | 4% | 42% | 54% | 50 |
Accumulation signals
8 tickers meet the bar (vol ratio > 2.0, |return| > 5%, MC ≥ $1B).
| Symbol | Sector | Return | Vol ratio | $ Volume | MC |
|---|---|---|---|---|---|
| IRON | Healthcare | +38.86% | 13.0x | $670.4M | $2.2B |
| TLK | Communication Services | -5.26% | 7.3x | $115.0M | $10.9B |
| PBCRY | Financial Services | -6.76% | 2.0x | $11.0M | $34.2B |
| MESO | Healthcare | -10.02% | 2.4x | $7.3M | $1.7B |
| BKRKY | Financial Services | -6.01% | 7.2x | $5.5M | $22.0B |
| PPERF | Financial Services | -16.98% | 93077.7x | $2.0M | $23.4B |
| OILSF | Energy | +17.31% | 2.2x | $1.5M | $1.0B |
| BVC | Technology | -5.24% | 2.1x | $1.2M | $2.2B |
Sector flips
No breadth flips (70%+ → 30%-) today.
Opposed pairs that were not opposed yesterday:
- Communication Services vs Financial Services
- Communication Services vs Healthcare
- Communication Services vs Industrials
- Consumer Cyclical vs Financial Services
- Consumer Cyclical vs Healthcare
- Consumer Cyclical vs Industrials
- Financial Services vs Technology
- Healthcare vs Technology
- Industrials vs Technology
Sector pair matrix
         MATL   COMM   DISC   STPL   ENRG    FIN   HLTH   INDU   REST   TECH   UTIL
  MATL   1.00  -0.59  -0.41   0.24   0.44   0.04  -0.11   0.01   0.12  -0.51   0.31
  COMM  -0.59   1.00   0.62  -0.14  -0.32   0.43   0.03   0.36   0.21   0.59   0.08
  DISC  -0.41   0.62   1.00  -0.13  -0.66   0.42   0.26   0.38   0.33   0.61  -0.03
  STPL   0.24  -0.14  -0.13   1.00   0.30   0.42   0.55   0.08   0.50  -0.73   0.35
  ENRG   0.44  -0.32  -0.66   0.30   1.00   0.09  -0.47   0.03   0.08  -0.45   0.37
   FIN   0.04   0.43   0.42   0.42   0.09   1.00   0.25   0.57   0.82   0.05   0.68
  HLTH  -0.11   0.03   0.26   0.55  -0.47   0.25   1.00   0.05   0.30  -0.32   0.06
  INDU   0.01   0.36   0.38   0.08   0.03   0.57   0.05   1.00   0.56   0.41   0.50
  REST   0.12   0.21   0.33   0.50   0.08   0.82   0.30   0.56   1.00  -0.09   0.60
  TECH  -0.51   0.59   0.61  -0.73  -0.45   0.05  -0.32   0.41  -0.09   1.00  -0.15
  UTIL   0.31   0.08  -0.03   0.35   0.37   0.68   0.06   0.50   0.60  -0.15   1.00
Capitulation watch
No new capitulations today.
Notes / data gaps
- 277 tickers dropped (no sector or no marketCap).
- 2026-10-19: $130.79T of $131.07T cap reporting (100%); 55 names (mostly late-publishing foreign ordinaries) excluded.
Market-structure reporting: capital flows, breadth and volume signals across Fam's watchlist. Not personalized investment advice, and not buy or sell recommendations.